Converting tabular data to RDF: Convert Excel to CSV
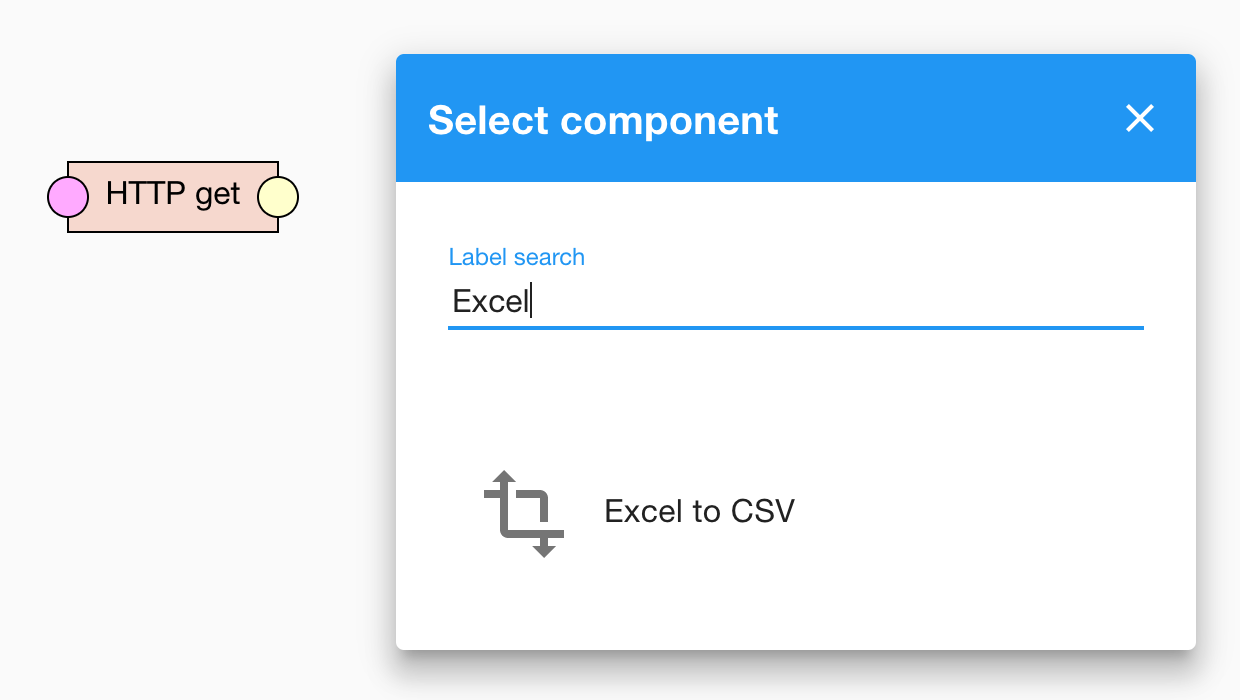
The first step of the data transformation is converting the Excel spreadsheet into CSV. We start by downloading the spreadsheet using the HTTP GET component of LP-ETL. To add a component to the pipeline's canvas, right-click the canvas and select the option to insert a component. A menu appears that lists the available components. You can quickly filter the components by typing a few characters of their names. We pipe the downloaded file into the Excel to CSV component. You can pipe a component's output by dragging an edge from the component's output port to the target component's input port. Port are displayed as circles on the sides of the components. By convention, the ports on the left are inputs and the ports on the right are outputs. You can also drop the dragged edge onto an empty canvas, in which case LP-ETL suggests the components that have an input compatible with the edge.
There are several options that we can configure in the Excel to CSV component.
In this case, we convert the Excel spreadsheet into multiple CSV files; one for each sheet.
However, the spreadsheet contains not only sheets with LAU codes, but also sheets with explanatory notes.
Fortunately, each sheet with LAU codes is named with a two-letter country code.
This allows us to select the sheets of interest by using the regular expression [A-Z]{2} in the Sheet filter option.
We can also use the sheet names to distinguish the names of the produced CSV files.
We can refer to the sheet name via the {SHEET} variable in the Output file template option.
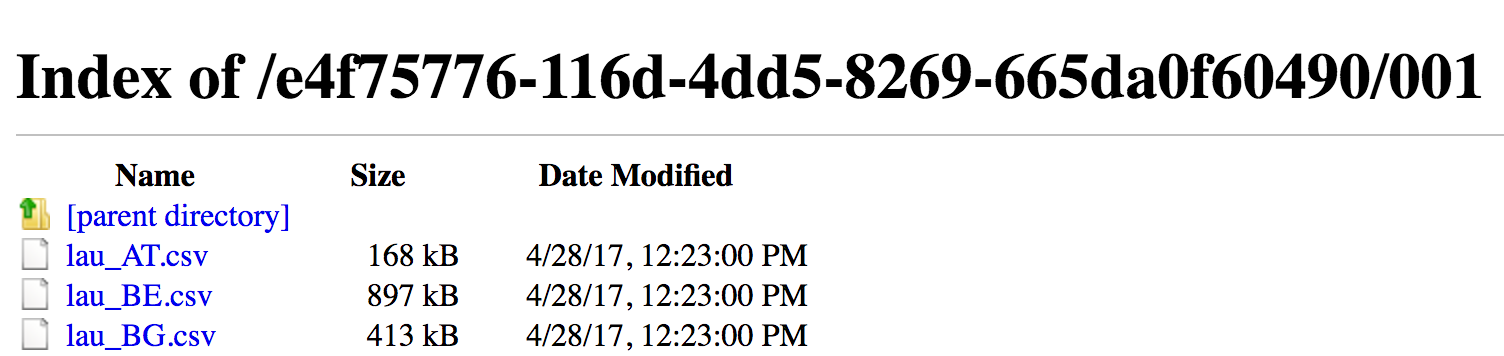
We enter lau_{SHEET}.csv as the value of this option, so that files like lau_DE.csv or lau_CZ.csv are produced.
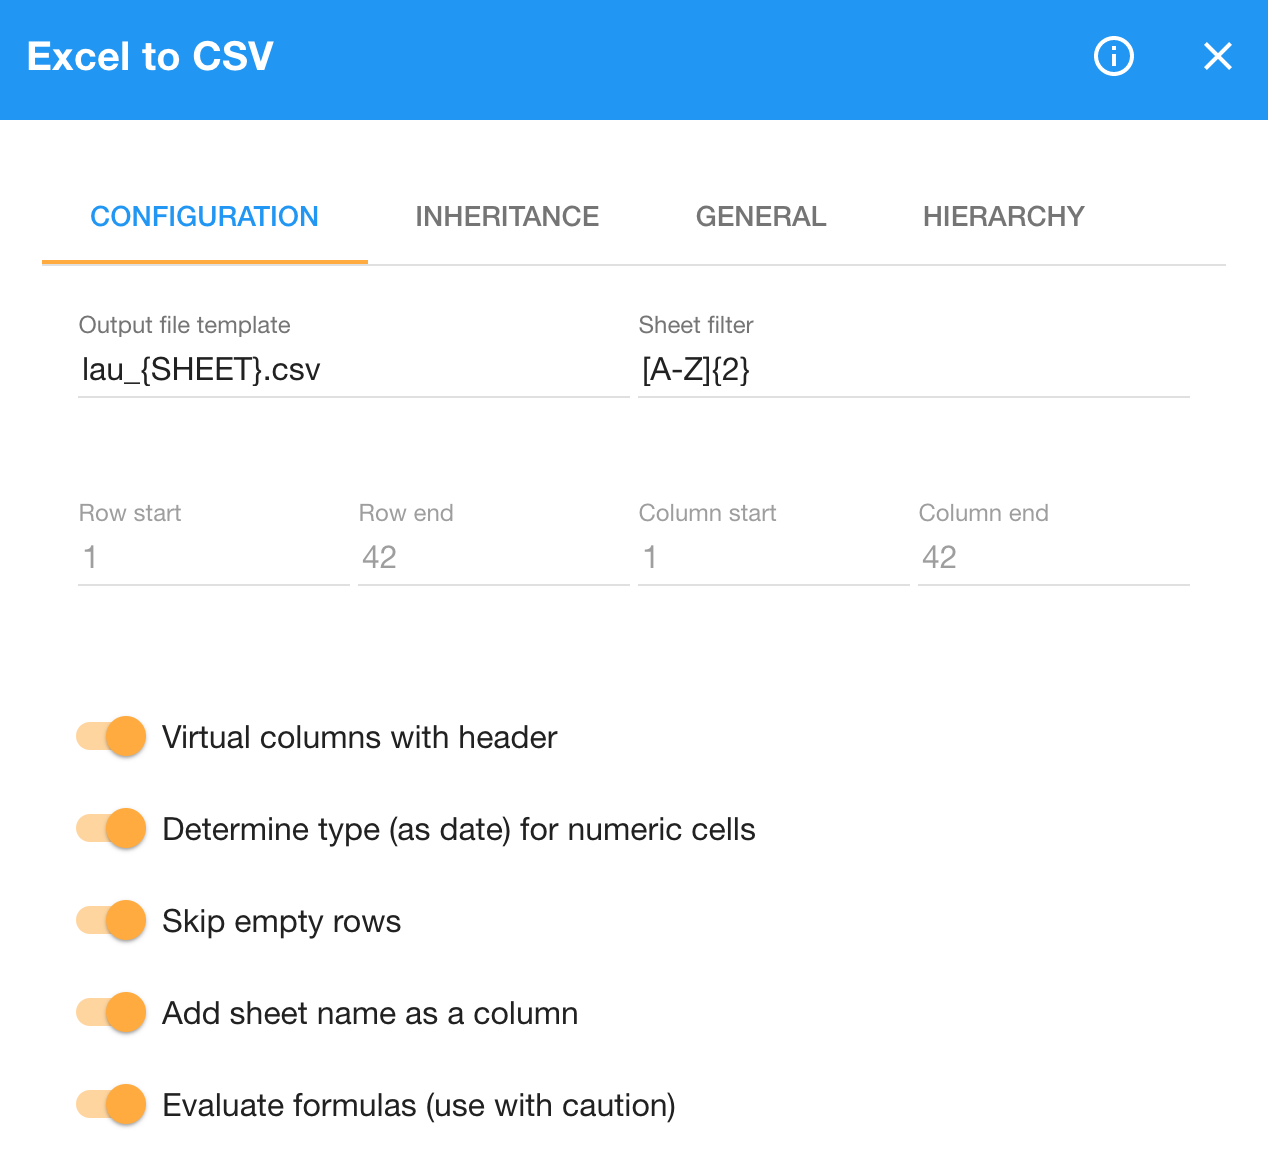
In order to be able to differentiate the countries in the later steps of the transformation, we switch on the Virtual columns have header and the Include sheet name as additional column options, which append the sheet names as an additional sheet_name column in the produced CSV files.
Similarly, we turn on the Skip empty rows option, since the spreadsheet contains unnecessary empty rows.
The spreadsheet also features formulas left in by omission, so we enable the Evaluate formulas option to turn them into data.
Without having this option switched on, the component would raise an error alerting us about formulas present in the spreadsheet, which is likely the way you would find about them during the iterative pipeline development.
If you change an option and do not want to re-run the whole pipeline, you can re-run a transformation step by clicking the Debug to this component button on the reconfigured component. When the pipeline execution completes, you can click through to its execution view and click the output of the Excel to CSV component to view the generated CSV files.

When you click the output port of the Excel to CSV component a listing of the CSV files produced by the component is shown.
Viewing one of the files reveals the table structure. For example, in the `lau_FI.csv` file for Finnish LAU, you can find the following rows:
| NUTS_3 | LAU1_NAT_CODE | LAU2_NAT_CODE | CHANGE | NAME_1 | NAME_2_LAT | POP | AREA | sheet_name |
|---|---|---|---|---|---|---|---|---|
| FI194 | 146 | 005 | no | Alajärvi | Alajärvi | 10006 | 1056740000 | FI |
| FI196 | 041 | 050 | no | Eura | Eura | 12128 | 630200000 | FI |
| FI193 | 131 | 592 | no | Petäjävesi | Petäjävesi | 4008 | 495420000 | FI |
The pipeline to replicate this transformation step can be found here.